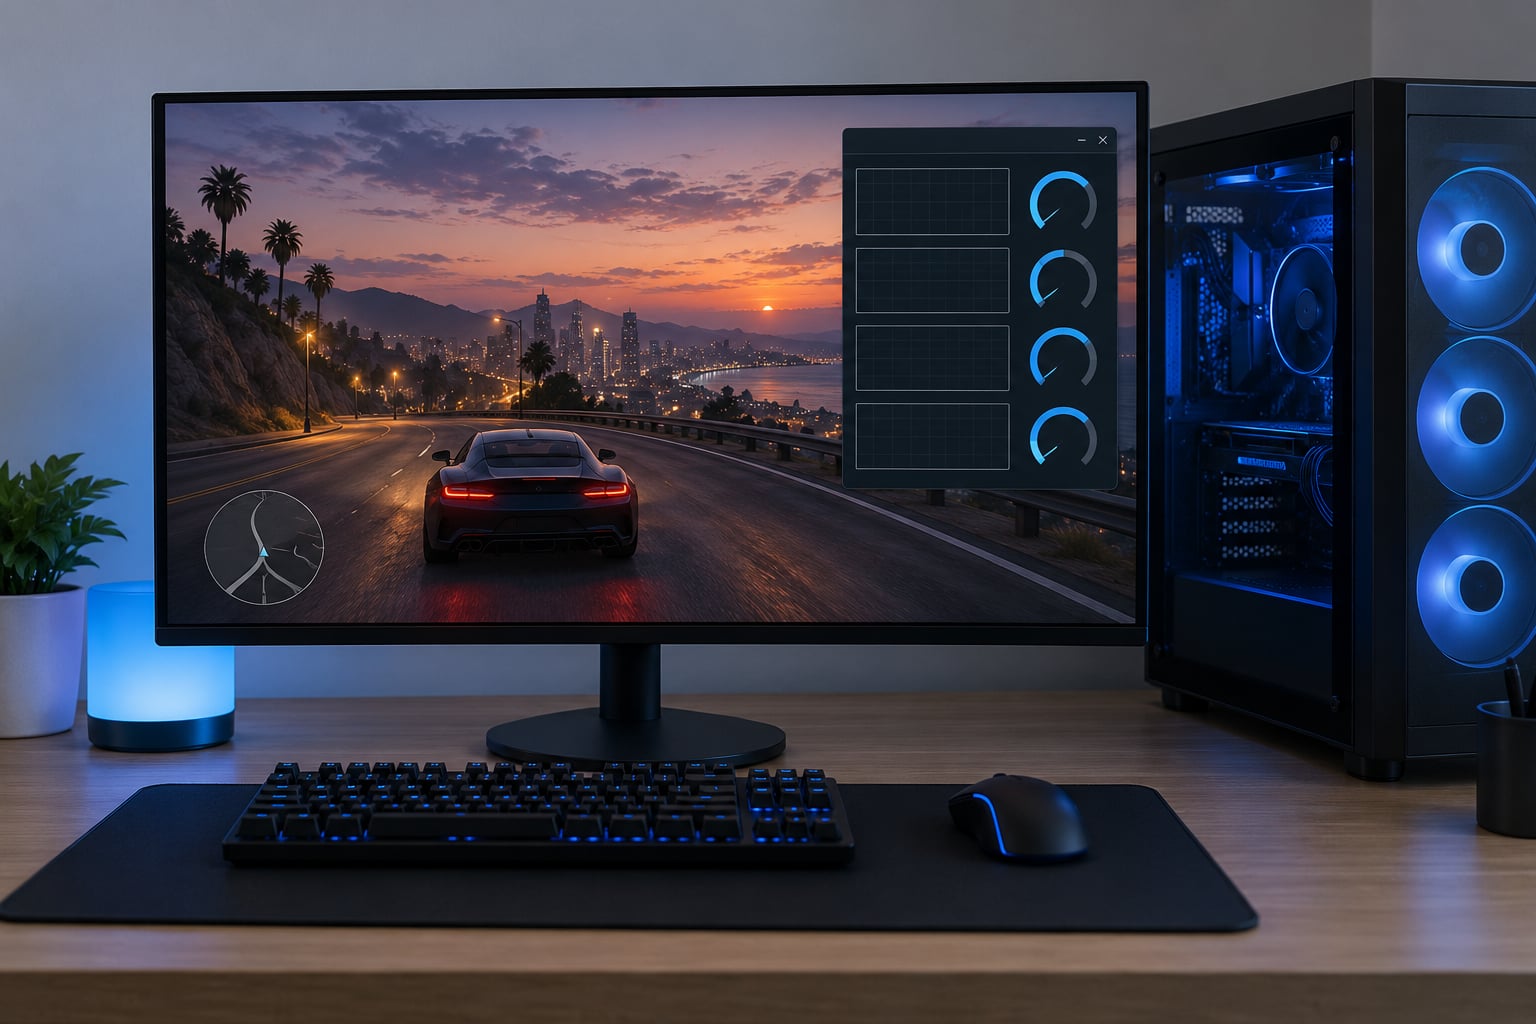
To monitor GPU temps while testing mods, run a free overlay like MSI Afterburner with RivaTuner Statistics Server (or HWiNFO64 feeding that same overlay) on top of GTA V, and watch the hotspot sensor, not just the core number. The whole method takes about five minutes to set up, but it only works if you record an unmodded baseline first, because a single temperature reading with no comparison tells you nothing.
Here is the workflow I use. Set up one sensor overlay, run a repeatable ten-minute route on vanilla GTA, note the numbers, then load the mod and run the exact same route. Same weather, same time of day, same resolution, same camera position. If you change two things at once, the comparison is worthless.
This matters more than it sounds. A 4K texture pack, an ENB preset, or a VisualV rewrite can push your card to its thermal limit in a way vanilla never does. Without a baseline you cannot tell whether a frame-rate drop is heat, throttling, VRAM exhaustion, or the CPU choking on a hundred loaded scripts.
Table of Contents
- 1What You Need
- 2Step-by-Step
- 3How do you choose a monitoring method on Windows?
- 4How do you set up a clean baseline?
- 5How do you test the mod under realistic load?
- 6How do you read the results and stop safely?
- 7What are the common mistakes?
- 8What should different types of GTA mods be tested for?
- 9Frequently Asked Questions
- 10What GPU temperature is safe while testing GTA mods?
- 11Why does GPU temperature spike suddenly during a mod test?
- 12Should I monitor GPU temperature or CPU temperature?
- 13What is the easiest way to monitor GPU temps on an AMD PC?
- 14Does a high GPU temperature mean I should uninstall a mod?
- 15Can GPU temperature readings prove a mod is stable?
- 16Conclusion
What You Need
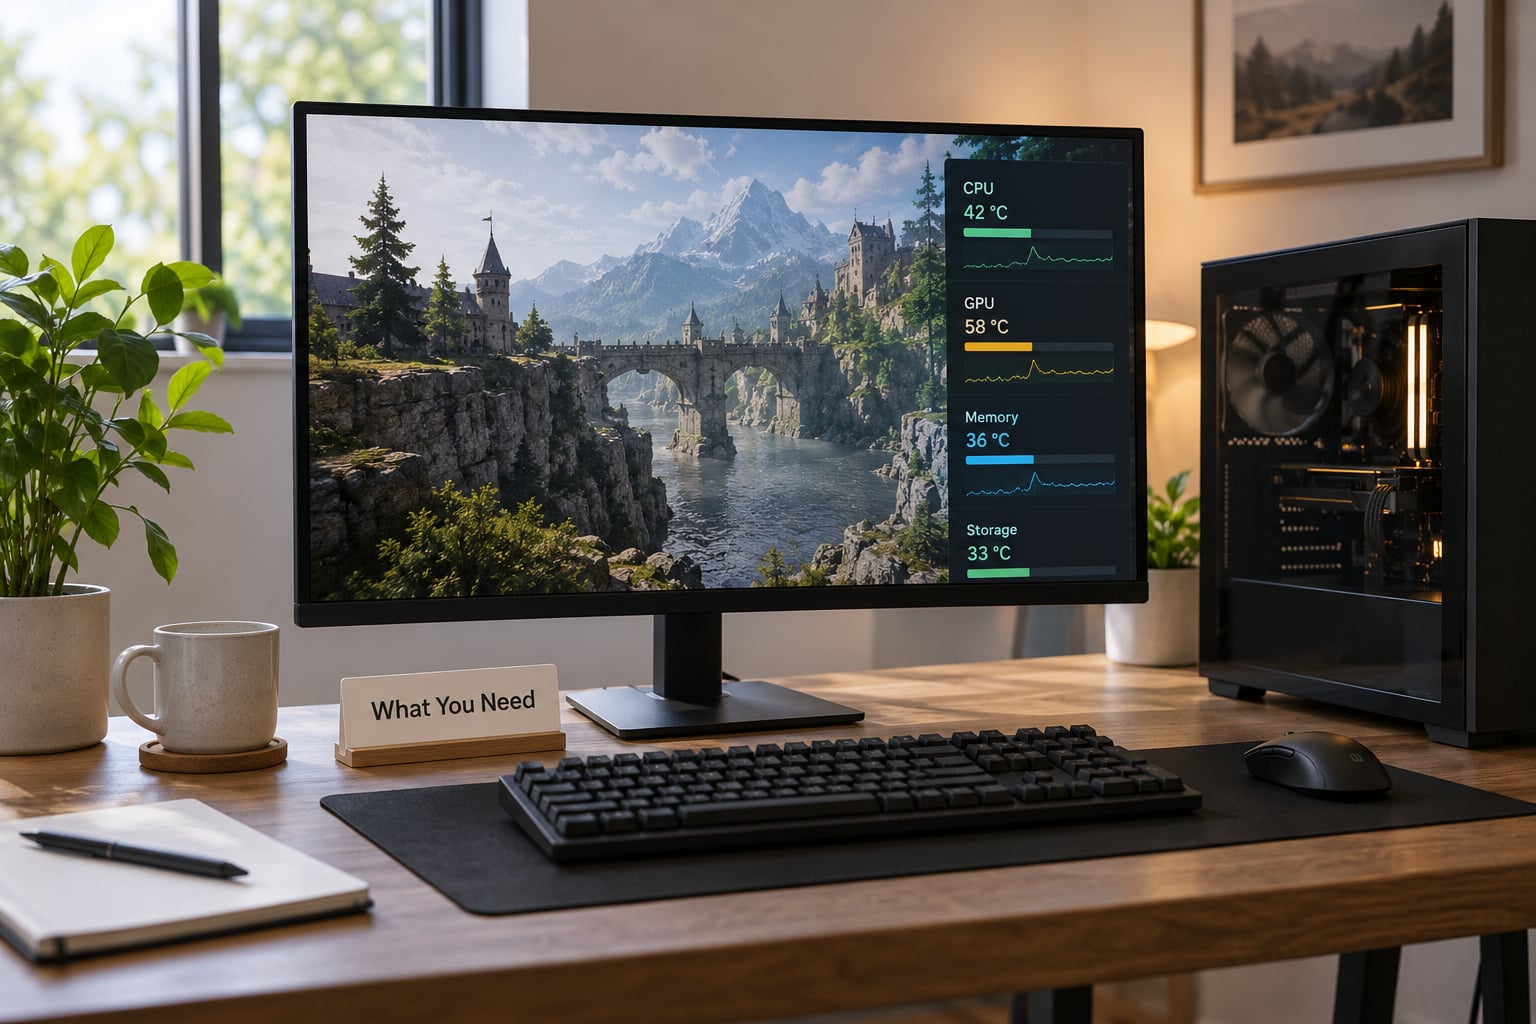
You need four things: a Windows PC, an up-to-date GPU driver, one sensor overlay, and about thirty minutes of free time for the two test runs. That is the whole kit. Nothing here needs to be bought.
The driver matters more than it should. Outdated drivers report sensors incorrectly and some older versions drop readings entirely after a cold boot, which is one of the most common complaints in the r/pchelp and r/overclocking threads on this exact problem.
Pick your overlay based on which GPU you have:
- NVIDIA card: MSI Afterburner plus RivaTuner Statistics Server gives you the full picture, including clock speed, fan RPM, memory usage, and frame time. CapFrameX pairs well with it if you want frametime graphs.
- AMD card: AMD Software (Adrenalin Edition) already has a built-in metrics overlay under Performance. MSI Afterburner adds fan curve and power limit control on top.
- Laptop or Steam Deck: use the same overlay but read the results very differently, because laptop cards throttle far earlier than desktops.
HWiNFO64 is the optional piece most people skip and then regret skipping. It reads sensors straight from the hardware and the modding crowd treats it as the source of truth when Afterburner and Windows Task Manager disagree.
Before you run anything, verify the readings are real. Start the game, park at a loading screen, and check the idle numbers. Core temperature should sit near room temperature, roughly 25 to 40 degC, with GPU usage at 0 to 2%. If you see 0% usage and 6% temperature, you are reading the wrong GPU or the wrong sensor.
Step-by-Step
How do you choose a monitoring method on Windows?
Use MSI Afterburner with RivaTuner Statistics Server for anything more than a quick glance. It is free, it works with both NVIDIA and AMD cards, and it is what forum veterans reach for first.
The setup path: install MSI Afterburner, which bundles RivaTuner Statistics Server in the same folder. Open Afterburner, go to the Settings gear icon, then the On-Screen Display tab. Tick On-Screen Display, set Overlay Temperature Units to Celsius, and tick Show Temperature. Click Customize to pick your sensors.
For frame data, open the RivaTuner Statistics Server folder, launch RTSS.exe, and go to Settings. In the On-Screen Display tab, tick Cpu/GPU Information for each adapter you want numbers for, then press the Statistics tab to add Framerate, Frametime, and GPU memory. Set a hotkey, usually Insert or Home, to hide and show the overlay.
If you already run HWiNFO64, you can have RTSS display those sensors instead. Start HWiNFO64 as a background shared-memory sensor, click the gear icon in the sensors window, enable Shared Memory Support, and leave it running minimized. Then open RTSS, go to the Monitoring tab, tick HWiNFO64 Shared Memory Support, and pick the GPU sensors you want. RTSS will now pull numbers from HWiNFO64 directly.
On NVIDIA, the driver overlay is Alt+R and lives in the NVIDIA App under Settings, then Overlay. It is quicker to open and adds no hook, but it is thinner on sensors and cannot be logged. On AMD, AMD Software, then Performance, then Metrics, then Show Metrics Overlay. Either driver overlay is fine for watching a single run. Neither is good for the A/B comparison, because you cannot easily record what you saw.
How do you set up a clean baseline?
A baseline is an unmodded run on the exact route you will use for testing. Without it you have nothing to compare against, and a temperature reading on its own means very little.
Close every background game, browser tab with video, and unused launcher. Right-click the taskbar and open Task Manager, then the Performance tab, and confirm the GPU engine at the bottom shows 0 to 2% while the game sits on the menu. Leave at least ten seconds between each action so the sensors settle.
Then run the test route on vanilla. A good one for GTA V is a drive from the airport into downtown, a scripted panic in the city centre, and a fast ride along the highway. Pick something with heavy geometry and lots of traffic so the GPU actually works.
Run it for ten to fifteen minutes. Longer than that matters if your card takes a while to reach its thermal plateau. Keep the resolution, window mode, and graphics settings locked, because a change in any of them invalidates everything you recorded.
Write down five numbers before you install anything: average core temperature, peak hotspot temperature, average FPS, 1% low FPS, and peak VRAM usage. That is your baseline row.
How do you test the mod under realistic load?
Install or enable the mod, then repeat the run exactly. Same route, same time of day, same weather, same graphics preset, same camera angles. If you are testing a weather mod, lock clear skies for the test rather than letting rain roll in halfway through.
Watch five readings on the overlay at once: GPU temperature, GPU utilization, memory usage, frame rate, and frame time. They tell you different things, which is why all five matter.
A healthy GPU-bound test shows 95 to 99% utilization and 95 to 100% memory usage during heavy scenes, with core temperature climbing and then flattening. Frame time should stay steady even as average FPS moves around.
A test that shows 30 to 40% GPU utilization at high temperature is odd and worth investigating. So is one where GPU utilization is healthy but VRAM is pinned at 100% and frame time spikes, because that is a memory limit rather than a heat problem.
Run fifteen to twenty minutes. Modders on r/skyrimmods have settled on that range for a reason: shorter runs often finish before the card reaches its plateau, and you end up comparing a cold start against a warm one.
How do you read the results and stop safely?
Compare each number against your baseline and ask one question: did this mod make the GPU do more work, or did it just move work off the GPU and onto the CPU?
Here is the reference most cards share. Idle sits at 30 to 45 degC. A comfortable gaming target is under 75 to 80 degC core. Sustained 83 to 85 degC is where you start paying attention. Around 90 degC you are near the hardware protection point, which is a shutdown limit, not a target.
| State | Core temperature | Hotspot | What to do |
|---|---|---|---|
| Idle at menu | 25-40 degC | 30-45 degC | Normal. Anything higher means a background process is using the GPU. |
| Comfortable gaming | Under 75-80 degC | Under 90 degC | Nothing. Keep testing. |
| Pay attention | 83-85 degC | 93-95 degC | Add a fan curve or stop extending the run. |
| Action needed | 88 degC and climbing | Over 95 degC | Exit the game, cool down, fix airflow before testing again. |
| Hardware protection | Near manufacturer max | Near max plus 10 | Shutdown point. This is a ceiling, never a goal. |
Thermal throttling is the thing to catch early. Watch clock speed alongside temperature: if cores drop while temperature stays high and FPS falls with them, the card is protecting itself. Stutter with no temperature climb is a different problem, usually CPU or RAM.
To stop safely, exit the game normally rather than alt-tabbing away. Then disable or remove the mod and confirm the game still launches clean on vanilla. Keep a copy of your mods folder before each test so you can drop back in seconds instead of reinstalling.
What are the common mistakes?
Watching CPU temperature instead of GPU temperature is the big one. Heavy mod packs are frequently CPU-bound, so you can sit at 75 FPS with a cool GPU and a 95 degC CPU, then blame the wrong component. Both numbers on the overlay, always.
Comparing different scenes is the second. Testing the city at noon and the highway at midnight gives you two temperatures, one of which is meaningless. Same route, same conditions, every time.
Using an unstable benchmark as your test loop causes more confusion than it solves. GTA V itself is a better benchmark for a GTA mod, because it loads the same assets, scripts, and streaming system the mod will touch.
Ignoring VRAM is a fourth. When a high-res texture pack pushes memory to 100%, the stutter has nothing to do with heat, and no amount of fan tuning fixes it. Read memory usage as carefully as temperature.
Running two overlays at once is the fifth. Afterburner plus CapFrameX plus the Steam overlay is three hooks drawing over the same frame. If you see stutter after installing monitoring tools, turn two of them off before blaming the mod.
And treating a single spike as a failure is the last. A five-degree jump during a texture load or a shader compile is normal. Sustained high readings over several minutes are what matter.
What should different types of GTA mods be tested for?
Graphics presets and ENB rewrites are the most thermal-hungry thing you will test. Watch core and hotspot every minute, and push the time of day to night if the preset includes volumetrics, because volumetric lighting is where thermal ceilings get hit.
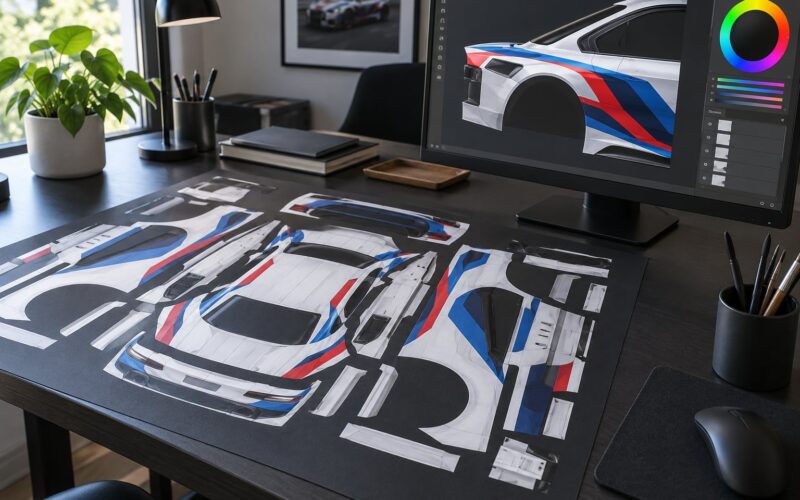
Vehicle mods rarely move temperatures much on their own, but high-poly add-ons with custom liveries can. Watch VRAM more than temperature here, and test at a busy intersection where every NPC car is loading at once.
Map mods are the ones most likely to expose a bottleneck rather than create one. A new map can tank frame rate through streaming hitches with GPU temperature completely flat. Frame time is the number that tells you this.
HUD and UI changes are cheap. If a HUD mod drops your frame rate, the problem is script overhead or a resolution lock, not heat. Check the resolution scale setting first.
Mobile and Android conversion tests are a different animal entirely, since you are usually checking whether a conversion runs at all rather than how hard it loads a GPU. Watch memory use and crash behavior, and keep your desktop log as the reference point for what the scene should look like.
Frequently Asked Questions
What GPU temperature is safe while testing GTA mods?
Aim to keep core temperature under 75 to 80 degC during a mod test and treat 83 to 85 degC as your attention point. Hotspot normally sits 10 to 15 degC above core, so a hotspot near 90 degC with a core reading of 78 is still fine. The manufacturer maximum printed on the card is a shutdown threshold, not a target.
Why does GPU temperature spike suddenly during a mod test?
Most spikes come from one-time work: a new area streaming in high-resolution textures, compiling shaders, or switching shaders mid-frame. A short jump of a few degrees that returns within seconds is normal. Sustained high readings that hold for several minutes are the ones worth stopping for, because that is where thermal throttling starts.
Should I monitor GPU temperature or CPU temperature?
Both, at the same time. Heavy GTA mod packs are often CPU-bound, so you can lose frame rate with a perfectly cool GPU. Putting CPU package temperature and core clock next to your GPU sensors on the same overlay makes the bottleneck obvious within about a minute of testing.
What is the easiest way to monitor GPU temps on an AMD PC?
Open AMD Software, go to Performance, then Metrics, and switch on Show Metrics Overlay. Press Alt plus the chosen key to toggle it. For recorded before-and-after comparisons, run HWiNFO64 in shared-memory sensor mode and let RivaTuner Statistics Server pull the readings, which is the setup most experienced modders trust.
Does a high GPU temperature mean I should uninstall a mod?
Not automatically. If the card held 78 to 82 degC with a stable frame time, the mod is doing its job and your cooling is doing its job. Uninstall only when readings sit in the 88 to 90 degC range, clocks are visibly dipping, or frame time stutters in step with the heat. Otherwise adjust a fan curve and keep the mod.
Can GPU temperature readings prove a mod is stable?
No. Temperature tells you only whether the hardware is coping, not whether the mod behaves correctly. A mod can run cool and still stutter, or crash on entering a streamed area. Stability comes from frame time holding steady across a full run, VRAM staying under capacity, and no crashes, with temperature as one supporting signal.
Conclusion
Start with a ten-minute unmodded baseline and one trustworthy overlay. Set up MSI Afterburner with RivaTuner Statistics Server, or HWiNFO64 feeding that same overlay, and put core temperature, hotspot, memory usage, frame rate, and frame time on screen.
Then run the same route again with the mod installed and compare the two rows side by side. That comparison, not the raw number, is what tells you whether the mod is worth keeping.