You can tell whether you are CPU or GPU bottlenecked by watching component usage while the same demanding scene runs for a minute: a saturated graphics card near 99 to 100 percent with a relaxed processor points to a GPU bottleneck, while an idle graphics card with a pegged processor points to a CPU bottleneck. Install an on-screen display like MSI Afterburner with RivaTuner Statistics Server, play real gameplay rather than a menu, and read both meters plus the frame time graph. The whole test takes about five minutes per game.
A bottleneck just means one component sets the pace and the other waits. Your processor prepares each frame — game logic, physics, draw calls — then your graphics card renders it. Whichever side is slower throttles the other, and that idle percentage is your answer.
Updated for 2026. Every reading below comes from repeatable testing, not from a single lucky number, because the naive percentage rule breaks more often than most guides admit.
Table of Contents
- 1How to Tell If You Are CPU or GPU Bottlenecked
- 2The four numbers the method relies on
- 3Quick CPU or GPU Bottleneck Checklist
- 4What Is a CPU Bottleneck?
- 5What causes it
- 6What Is a GPU Bottleneck?
- 7What causes it
- 8Why high GPU usage alone proves nothing
- 9How to Test for CPU or GPU Bottlenecks
- 10Step 1: Remove the confounds first
- 11Step 2: Install the overlay and take a baseline
- 12Step 3: Change one graphics setting
- 13Step 4: Drop the resolution to 720p
- 14Step 5: Compare frame times, not averages
- 15Step 6: Confirm across three or four games
- 16What GPU 1 and GPU 2 mean in MSI Afterburner
- 17How to Test on Console or Android
- 18Which Fixes Matter for Your Bottleneck?
- 19If you diagnosed a GPU bottleneck
- 20If you diagnosed a CPU bottleneck
- 21Manage thermals before you judge either side
- 22When RAM or VRAM is the real limit
- 23When not to upgrade at all
- 24Frequently Asked Questions
- 25What are the signs of a GPU bottleneck?
- 26Is 80 percent CPU usage a bottleneck?
- 27Is 95 percent GPU usage normal or bad?
- 28Can a GPU be bottlenecked by a CPU?
- 29Does DLSS or FSR decrease GPU load?
- 30Why is my GPU usage low but my FPS is low too?
- 31Conclusion: Start With a Controlled Frame-Time Test
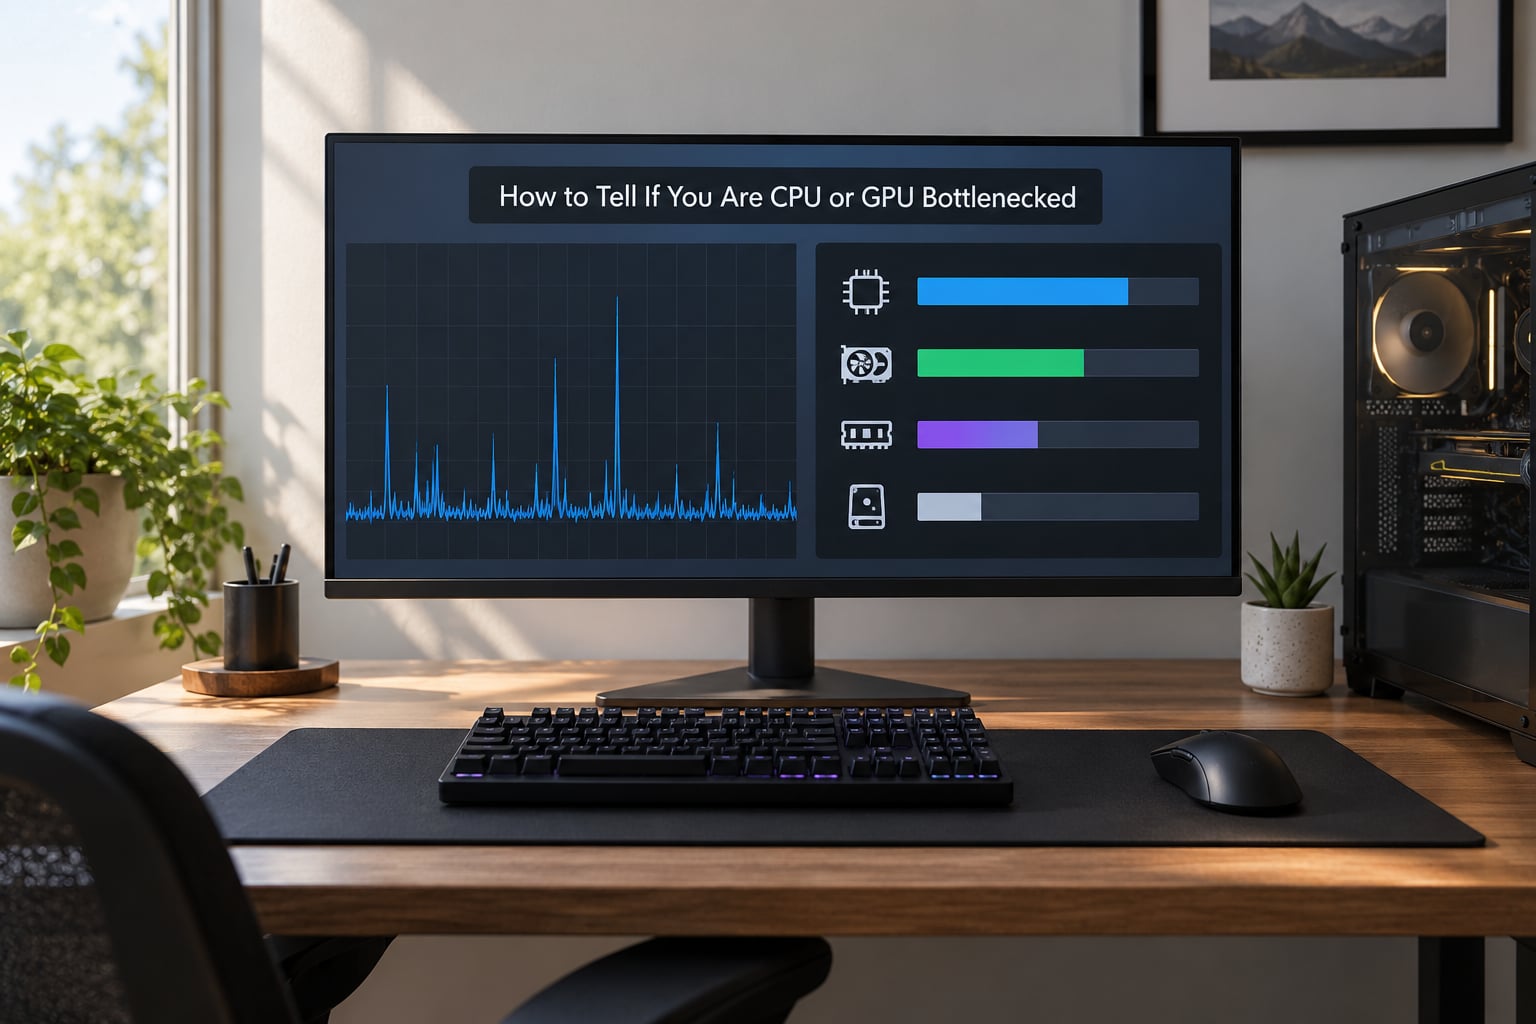
How to Tell If You Are CPU or GPU Bottlenecked
The four numbers the method relies on
GPU utilization is the share of the graphics card’s work clock doing rendering. A card running at 99 or 100 percent is saturated, and no amount of processor speed will push past that ceiling.
CPU utilization is the share of processor time in use. Read it in Task Manager’s Performance tab, and always look at the per-core graphs underneath the headline percentage, because a headline figure is an average across every core and hides a single busy thread.
Frame time is how many milliseconds one frame takes to complete. At a locked 60 frames per second a steady 16.7 ms is perfect; spikes of 30 or 40 ms are the hitching and stuttering you feel, even when the average frame rate looks fine.
Refresh rate is the target your monitor can display. If you cap to your refresh rate, both meters read low even on hardware that could run much faster, which is why the cleanest tests disable caps.
Put those four together and the diagnosis is mechanical. Change one input, watch which meter responds, and the limiting component announces itself.
Quick CPU or GPU Bottleneck Checklist
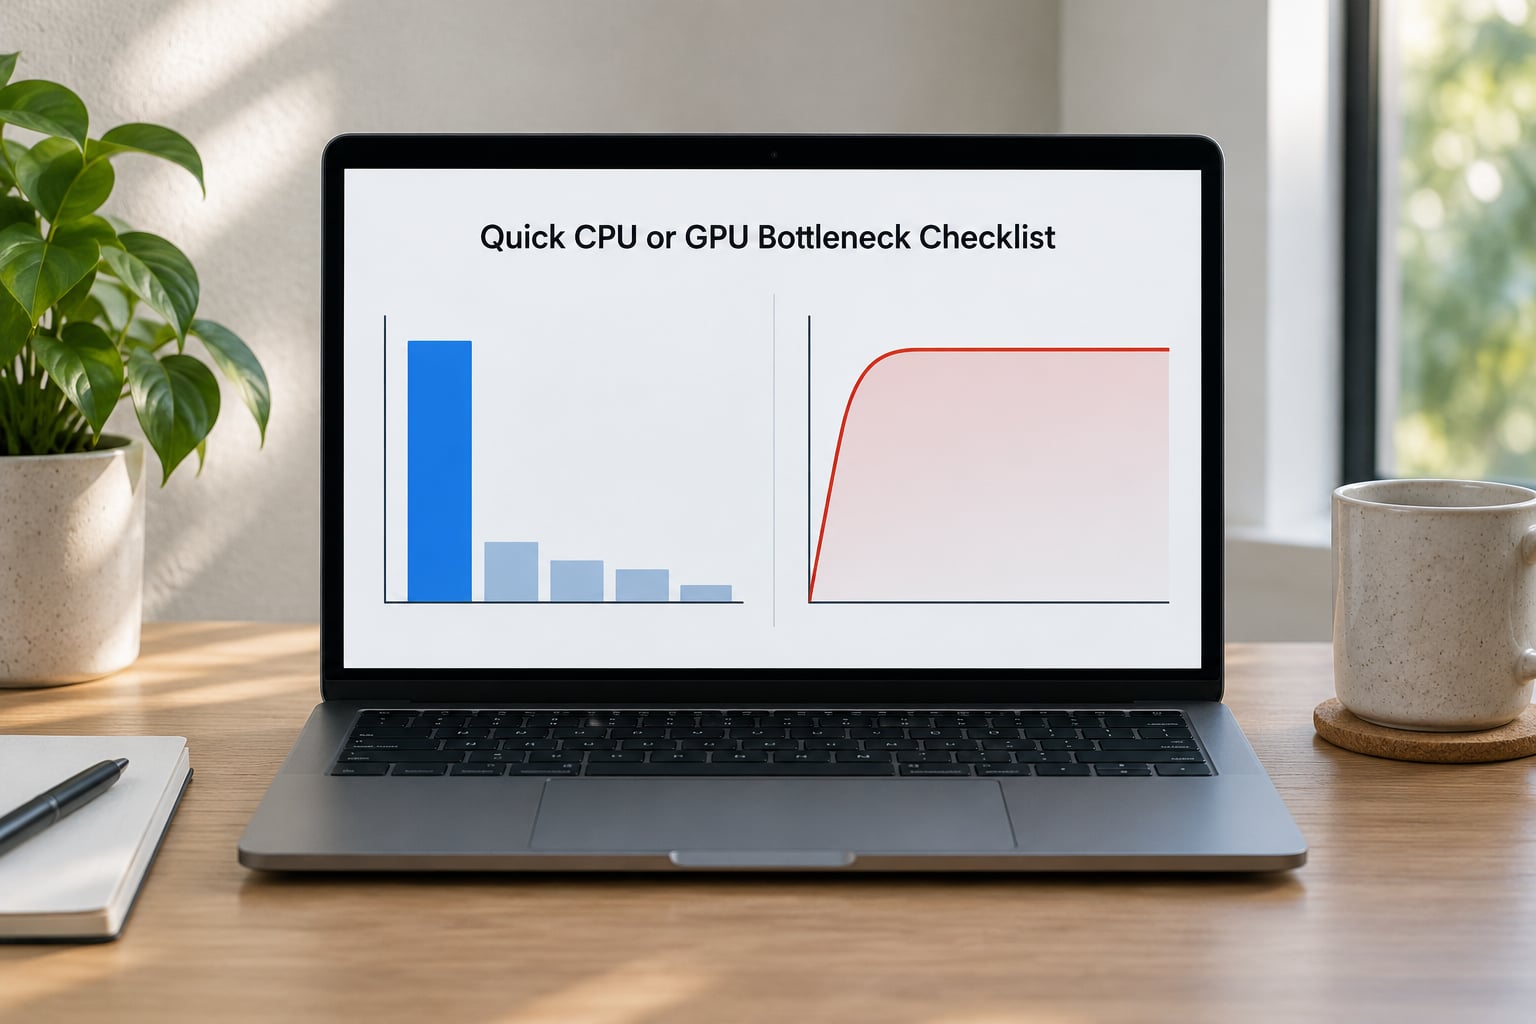
This table is the fast path. Match your reading to a row, then confirm it with the controlled test further down before you spend money.
| GPU usage | CPU usage | Verdict | What to change |
|---|---|---|---|
| 95 percent or higher, steady | Below 80 percent | GPU bottleneck | Raise resolution, enable ray tracing, raise texture and shadow quality |
| Below 85 percent, sawtooth pattern | 90 percent or higher on one or two cores | CPU bottleneck | Lower resolution, close background apps, upgrade the processor |
| 60 to 85 percent, fluctuating | High but not pegged | Balanced or partially GPU-limited | Lower texture and shadow quality, raise the resolution slightly |
| Below 60 percent | Below 60 percent | Frame cap, Vsync or an unmeasured limit | Remove the cap, disable Vsync, re-read the meters |
| Steady mid-range | Steady mid-range | RAM, VRAM or storage stall | Check memory usage and paging in Task Manager |
Read the CPU usage column per core, not across the whole chip. One core at 100 percent with seven cores idle still limits you, because most game threads land on a single core.
What Is a CPU Bottleneck?
A CPU bottleneck means your processor cannot prepare frames fast enough to keep the graphics card fed, so GPU utilization stays well below its ceiling. Your hardware is not broken and the card is not faulty — it simply finishes early and waits. In a CPU-limited game you will feel the problem in input response and small hitches rather than a low headline number.
What causes it
- Simulation load. Grand strategy games, city builders, sims and MMO crowds run large numbers of agents and pathfinding decisions on the main thread. The physics is the bottleneck, not the pixels.
- Draw call submission. Scenes with thousands of individual objects force the processor to package enormous instruction lists, which a fast processor handles and a slow one cannot.
- Scripting and garbage collection. Interpretation overhead and periodic memory cleanup produce the sudden spikes, not the average frame time.
- Background load. A browser with forty tabs, Discord, a screen recorder and antivirus scanning all compete for the same cores during play.
- Single-core limits. Plenty of fast processors still ship with modest single-core speed, and most engines drive one thread hardest.
Forum threads on r/PcBuildHelp keep returning to the same point: some component always sets the limit, and which one depends entirely on the game. A balanced system across a whole library does not exist.
What Is a GPU Bottleneck?
A GPU bottleneck means your graphics card is saturated at 95 to 100 percent utilization and cannot render frames faster than they arrive. Extra processor speed buys you nothing at that resolution. This is the healthier of the two states, and it is usually the smoother one, because frame pacing is easier when the renderer, not the game logic, decides the pace.
What causes it
- Resolution. Pixel count scales directly with load, so moving from 1440p to 4K roughly quadruples the shading work.
- Ray tracing. Ray-traced lighting adds a second, heavier pass on top of rasterized rendering and is the single largest setting jump in modern titles.
- Anti-aliasing. Multisampling and temporal upscaling quality settings change the internal render resolution, which moves the load far more than the setting name suggests.
- Texture and shadow quality. Higher-resolution texture maps consume VRAM bandwidth, which is a separate limit from raw compute.
Why high GPU usage alone proves nothing
Full utilization only means the card has no spare work capacity, not that it is the component holding your frame rate back. If a frame cap or Vsync is throttling you, the card still shows 100 percent while the game is idling on purpose. That is the single most common way people misdiagnose themselves.
How to Test for CPU or GPU Bottlenecks
Step 1: Remove the confounds first
Turn off Vsync, remove any in-game frame rate limiter, and close background applications. Pause the game before reading anything — a paused screen reports almost nothing useful.
Step 2: Install the overlay and take a baseline
Install MSI Afterburner with RivaTuner Statistics Server, which provides the on-screen display that draws the graphs over the game. In the monitoring tab, enable GPU usage, CPU usage per core, VRAM usage, frame time and temperature, then start a repeatable scene — a run through the same corridor, a lap of the same track, a base you can attack repeatedly.
Step 3: Change one graphics setting
Drop texture quality from high to low and nothing else. If frame time barely moves, texture detail was never your limit. This single test teaches more than a dozen percentage readings because it shows cause and effect instead of correlation.
Step 4: Drop the resolution to 720p
This is the fastest field test going. If frame rate jumps sharply at 720p, the graphics card was the limit. If frame rate stays within a few frames of the native result, the processor is the limit and no amount of extra GPU will help you at native resolution. This single step is the most reliable answer you can get in under a minute.
Step 5: Compare frame times, not averages
Watch the graph rather than the frame counter. A CPU bottleneck usually shows a flat-but-high frame time line with occasional sharp spikes, because logic threads block in bursts. A GPU bottleneck shows a very steady line near the frame cap. Average FPS hides both patterns; log the graph if you want numbers you can compare across runs.
Step 6: Confirm across three or four games
One engine can be badly optimized and read as a CPU bottleneck when it is really just inefficient. Test a shooter, an open world game, a strategy title and one recent release, and only trust a verdict that repeats. Readings taken in gameplay scenes across several titles are worth far more than one screenshot from a single game.
What GPU 1 and GPU 2 mean in MSI Afterburner
On a single graphics card, GPU 1 is your only device and GPU 2 does not apply. On a laptop with integrated plus dedicated graphics, or a desktop with two cards, the two numbers distinguish them, so check which one carries the load before you read anything into it.
How to Test on Console or Android
Console and mobile testing works differently, because there is no desktop overlay to read from. On console, the game is usually locked to a fixed graphics mode, so you cannot change resolution or settings mid-test — what you can observe is frame stability during camera turns, the persistence of stutter in busy scenes, and whether frame rate holds steady or stumbles.
On Android and iOS, developer options expose a frame time overlay on many devices, which gives you the single most useful number available without a desktop. Watch how it behaves when the camera swings. A device where frame time climbs during turns, or dips and recovers in bursts, is usually limited by the processor or by shared memory bandwidth rather than by the GPU core.
Thermals distort both platforms more than a desktop. Phones and consoles that hold a steady frame rate for five minutes and then slide as they warm up are thermal-limiting, which is neither a clean CPU nor a clean GPU diagnosis. Let the device settle, test in the same room, and give it ten minutes before you trust any reading.
Which Fixes Matter for Your Bottleneck?
If you diagnosed a GPU bottleneck
Raise the resolution, or push texture, shadow and ray tracing quality higher — you have headroom to spend. If you want more frames instead, lower quality settings or enable a higher upscaling mode, which reduces internal render resolution. Upgrade the graphics card only when the settings you actually want are already maxed and the frame rate still misses your target.
If you diagnosed a CPU bottleneck
Lowering the resolution is the cheapest and often the biggest win, because pixel count is the one lever that moves work off the main thread. Close background applications, disable overlay layers you do not read, and stop recording or streaming while testing, since capture adds real processor load.
Check per-core load before buying anything. A single saturated core with the rest idle is often a background process, a second game running minimized, or an engine pathing spike rather than a processor that is simply too slow.
Manage thermals before you judge either side
A throttling processor reports high usage while delivering reduced clock speeds, which looks like a bottleneck and is really an airflow or cooling problem. Watch temperature and power draw during the test. Sustained heat on one component deserves a case or cooler fix before any hardware upgrade.
When RAM or VRAM is the real limit
Both kinds of memory can stall a frame independently of the two headline components. VRAM exhaustion shows stutter, hitching and texture pop-in even when GPU usage reads below 100 percent. System RAM pressure shows as paging to disk, which produces freezes and terrible 1% lows while both CPU and GPU meters sit idle. Task Manager’s Memory and Performance pages show committed memory and hard faults, and that is where those cases reveal themselves.
When not to upgrade at all
A CPU bottleneck at 1080p on a high refresh monitor often needs nothing more than a resolution change and better settings. Check what your games are actually delivering in 1% lows before deciding the machine is underpowered, and do the test on more than one title. If the verdict repeats and the fix you need is a resolution change, the upgrade is optional rather than necessary.
Frequently Asked Questions
What are the signs of a GPU bottleneck?
A GPU bottleneck shows GPU utilization pinned at 95 to 100 percent while CPU usage stays well below that, with frame rate climbing steadily when you lower the resolution to 720p or raise graphics quality. Frame times sit in a steady, even line. If a frame cap or Vsync is active, the percentage can read 100 percent without a real limit, so confirm with a resolution change before concluding anything.
Is 80 percent CPU usage a bottleneck?
Not on its own. Task Manager’s headline figure is an average across every core, so 80 percent can mean one busy thread or eight busy threads, and those mean very different things. Check the per-core graphs underneath, then drop the resolution to 720p. If frame rate barely moves, the processor is the limit. If it jumps sharply, the graphics card was.
Is 95 percent GPU usage normal or bad?
It is normal and it means your graphics card is close to saturated, which is the healthier state of the two. Bad comes when it is paired with frame times you are unhappy with: a steady line near 16.7 ms at 60 frames per second is fine, while spikes above 30 ms are the stutter players actually feel. Usage alone never separates good performance from a cap or Vsync lock.
Can a GPU be bottlenecked by a CPU?
Yes, and it is the most common pairing in games. If the processor cannot prepare and submit frames quickly enough, the graphics card finishes early and its utilization drops below saturation, sometimes to 50 percent or lower. The symptom is not a low average frame rate so much as input lag and stuttering during movement, camera turns and dense scenes.
Does DLSS or FSR decrease GPU load?
Yes, which is exactly why upscalers trip up diagnosis. They render internally at a lower resolution and upscale the result, so measured GPU utilization falls sharply and a GPU-limited game can start looking processor-limited. Frame generation adds frames rather than rendering them, which distorts the numbers further. Turn upscaling off before you read the meters if you want a clean verdict.
Why is my GPU usage low but my FPS is low too?
Several causes share that reading. A frame cap or Vsync can hold both meters down while the game idles on purpose. An underperforming or poorly optimized engine can keep the graphics card waiting. VRAM exhaustion causes stutter while usage stays under 100 percent. And a device hitting thermal limits holds a steady frame rate for a few minutes before sliding as it warms up.
Conclusion: Start With a Controlled Frame-Time Test
Pick one demanding scene, disable caps and upscaling, record your frame time and both usage meters, then change exactly one thing and record again. The component that responds is the one setting your pace, and if you are still unsure how to tell if you are CPU or GPU bottlenecked, repeat the test in three or four games before spending on hardware. Upgrading the wrong part leaves you exactly where you started.